I saw a thread on r/UXDesign recently asking whether designers should bother adding real analytics to their portfolio. Squarespace and Framer give you the basics like unique visitors, bounce rate, session duration. Is it worth layering on something like Google Analytics or Mixpanel, or is it overkill for a simple portfolio site?
I would personally rather have a few extra data points about my own work than to have absolutely no idea whether people are actually visiting my site and browsing it. Even if it’s just a few clicks here and there, it’s a small data point that can help me understand how people are interacting with my work.
I’ve gone through a few tools over the years. Here’s what I actually use now, what I dropped, and why.
What I used to use
For years I used Google Analytics. It’s helpful at a surface level, but it’s also too complex for what a portfolio actually needs. And I found it cumbersome to set up custom event tracking for actions taken on the page. I have since transitioned off of GA altogether and don’t use it on any of my new projects (this site included).
I also tried Microsoft Clarity for a while. It’s free and genuinely useful for one thing: session replays. You can watch exactly how someone moved through your site. If I’m being honest, unless a portfolio website is super complex, I’m not really sure what is to be gained from viewing a live session replay of a hiring manager or potential collaborator browsing your site. Session replays are helpful for things like web apps where user flows are complex and you’re trying to pin down a reason for a low task success rate or why a page isn’t converting.
Microsoft says the script loads asynchronously and has no measurable impact on load time for most sites, and I didn’t notice a dramatic hit either. But the dashboard itself feels bloated and slow for what it does, the UI decisions are strange, and it never stopped feeling like a Microsoft product wedged into a workflow that didn’t need it. I don’t use Clarity anymore either.
The technical tradeoffs: script size and page speed
Page load speed is part of the UX. If my portfolio takes three seconds to load, I’ve already lost the person reading it before they see a single project. Even I lose my patience on websites that take an unnecessary amount of time to load. I run the same Umami setup across my three active sites, my portfolio, Tabba.so, and Doug’s type design website, so I looked at what the tracking script actually costs before committing to it everywhere.
Here’s roughly how the usual suspects stack up, by script size on the wire:
- Google Analytics (GA4): The industry default, and the heaviest by a wide margin. The script itself runs somewhere around 45KB. Add Google Tag Manager and a cookie consent banner, which most GA4 setups need, and you’re well past 100KB before your actual content loads. It’s built for ad attribution and enterprise reporting. A portfolio doesn’t need either.
- Mixpanel: This isn’t really a page-view tool, it’s a product analytics tool built for tracking funnels and user journeys inside an app. The library is noticeably heavier than any of the privacy-first options below, and bundle size is a long-running complaint in their own GitHub issues. For bigger projects with lots of collaborators, requiring lots of custom super-specific event tracking, Mixpanel is the right category of tool for that job. For a static portfolio or a typeface site, it’s a lot of weight for something you won’t use.
- Plausible: Lightweight and privacy-first. The script comes in under 1–2.5KB depending on how it’s configured. You can do custom event tracking for a set number of events but exceeding the limit is locked behind a paywall.
- Fathom: Same category as Plausible, similar tradeoffs. Script size lands around 1.6–2KB. Custom event tracking doesn’t do key-value pairs, you need to do a hardcoded string for every element.
- Umami: Around 2KB. Negligible impact on load time, no cookie banner required, and it gives me the custom event tracking I actually use without dragging in a full product analytics platform I don’t need. The only downside is that the cloud version has a limited 6 month retention period on the data stored, though you can either export datasets as you go, or self host for free.
Umami, Plausible, and Fathom are close enough on raw script weight that size alone isn’t what decided it for me. I went with Umami because was the dashboard is pleasing to use (quiet and simple), and how straightforward it is to wire up custom events in the code, consistently, across all of my different projects. You just add in custom events into the html and it’s handled automatically, no additional setup required. They advertise themselves as “private by default”, visitor data is anonymized, and they don’t use cookies nor require a GDPR banner. I also appreciated that Umami allows for a free self-hosted version, which I am currently testing since I run a small server from my home.
What I use now: Umami
That combination of size and control is why Umami runs across all three of my active sites. It’s privacy-focused, free, and much easier to wire up event tracking in code than GA ever was.
Here’s what I actually track in Umami:
Internal clicks: Which pages get clicked, and specifically which projects pull the most attention. Internal links get a location dimension as well as a destination added to it, as in, which links are clicked and where they physically are on the page.
Event tracking: You can set it up to fire a custom “event” when someone is clicked or interacted with by the user. For example, on pages with FAQs, like my Work Together page or the Tabba homepage, I track which questions get opened and read. This gives me a sense of what people actually care about. One interesting side effect of the auto-translate feature that browsers like Chrome have, is that when people view my site in, for example, Portuguese, the FAQs are tracked in that language. Mildly interesting.
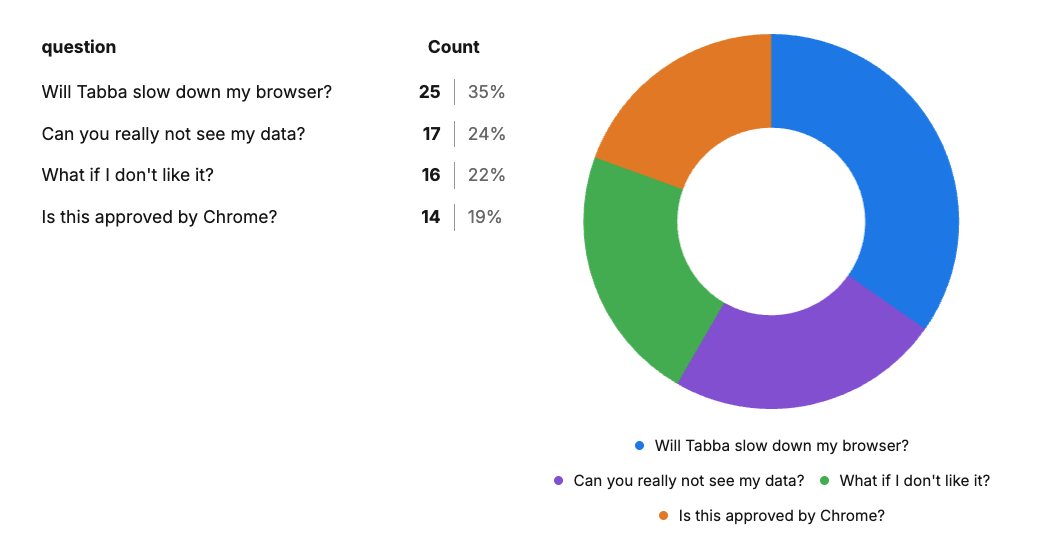
The top FAQ questions being opened on Tabba.so
External clicks: Which of my projects send people away from my site and out to the live product, or to a collaborator/client’s website. These are just as valuable as internal clicks because I do want my viewers to be checking out my work and clients.
For external links, I set up a custom Astro Component (apty named ExternalLink) which does a few things at once: Allows me to add in the URL itself, as well as some extra dimensions to slice and dice the data: the project being referenced, the text label itself, and context (e.g. a Client name, collaborator, social media link, something from my tech stack, and so on). This also lets me include consistent styling for all external links in one convenient place (at the component level rather than inline, since I have dozens of these all over my site). On the Tabba website, I also have a “Location” dimension so I can track the actual location of each Browser Install button that is clicked (e.g. in the hero, bottom of page CTA, or in the navbar/site header).
Here’s what my ExternalLink component looks like when added to the page.
<ExternalLink
  href="https://tabba.so"
  project="tabba"
  label="tabba.so"
  context="project">
  tabba.so
</ExternalLink>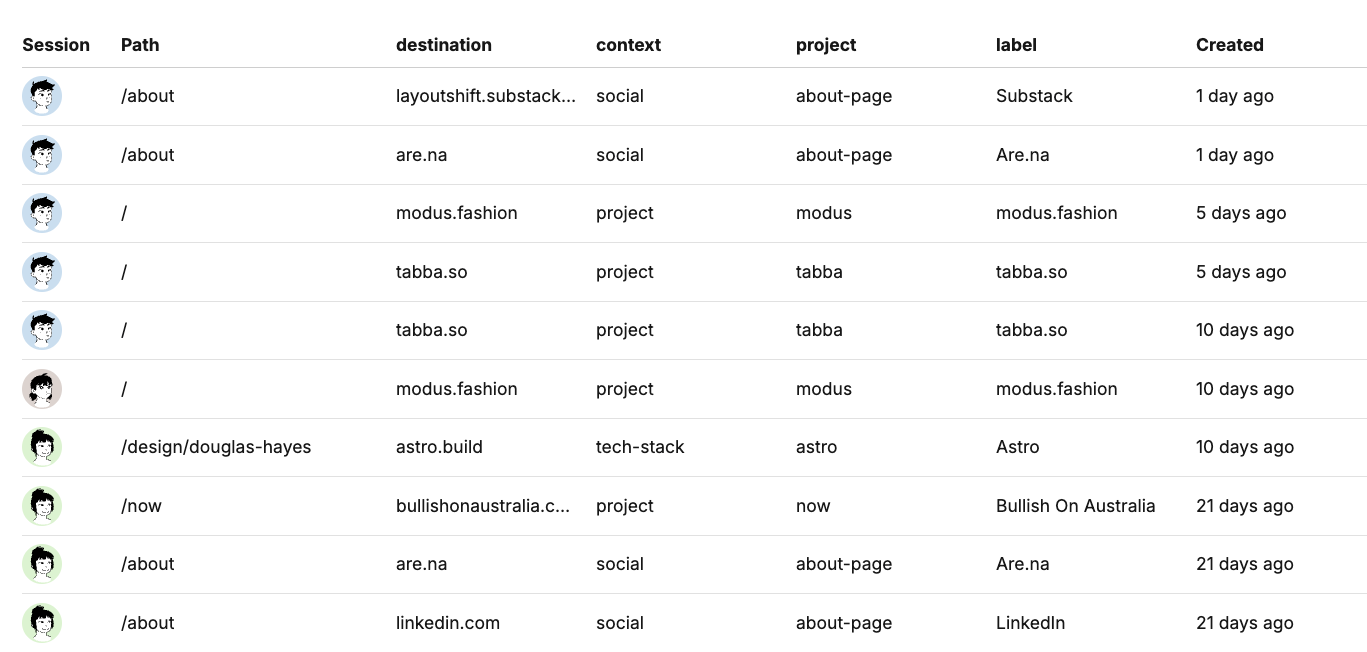
A screenshot of the Umami analytics dashboard showing external link clicks to various projects
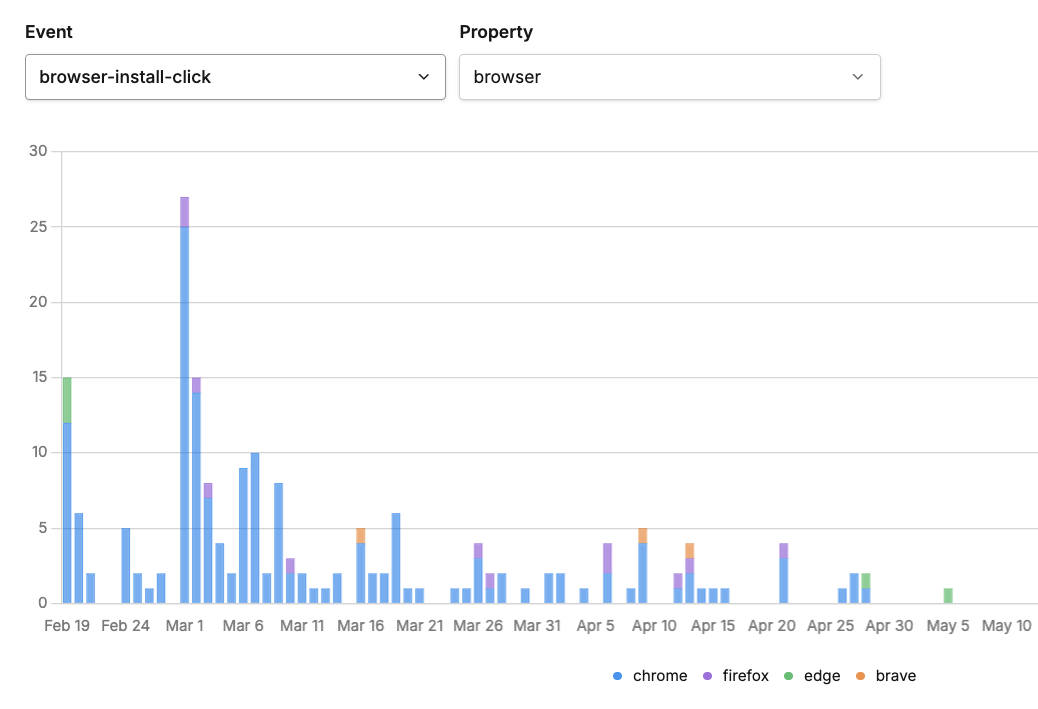
A screenshot of the Umami analytics dashboard showing browser install clicks for Tabba.so
Page views: straightforward, but still worth watching over time. It’s a helpful metric to see if I’m getting a lot of hits, for whatever reason. Also helps to know which projects/pages are most popular.
Referrals: where the traffic is actually coming from. When someone includes Tabba in their Substack or newsletter, I see a spike in specific referrals.
UTM tracking
When I submit job applications or proposals, I sometimes add UTM parameters to the link pointing back to my website. This matters most for automated ATS systems like Workday/Greenhouse/etc, and it’s somewhat helpful to know if my portfolio was actually clicked on for a specific job application.
I keep a UTM-tagged link on the portfolio URL printed on my actual PDF resume too. Every application becomes a small, separate data point instead of one undifferentiated number. In theory, I could include a unique UTM link in each resume I send out, but it’s tiresome to do this manually and I’m not entirely certain the juice is worth the squeeze.
Exclude yourself from your analytics
This might be obvious to some, but don’t forget to exclude your own browser(s) from being tracked by your own analytics. Including my own visits in my analytics skews my data quite a bit since I am always testing and refreshing.
I use Brave browser and so I actually block the entire Umami script from loading on my own website, which is foolproof and fairly simple to do, as it happens automatically on most sites. If you use another browser such as Chrome, you’ll want to do the following:
- Visits the website that loads Umami analytics
- Right Click → Inspect Element → Console (or Settings → More tools → Developer tools)
- In the console, enter the following code, the press
Enter
localStorage.setItem('umami.disabled', 1);To include yourself again, enter the following code in the same console:
localStorage.removeItem('umami.disabled');Why I wouldn’t treat my portfolio like a client’s website
A client’s website usually has a clear, narrow goal: run ads (and know which ones are converting), drive traffic, sell something, book some demos. A portfolio doesn’t have one goal. It might be:
- Getting hired, if you’re out of work
- Getting a better or more satisfying job, if you’re not
- Maximizing total visitors
- Creative expression, a digital garden of your projects and interests
- Going viral and hoping something happens from it (it’s like playing the lottery)
I would caution against over-analyzing and looking for meaning in your analytics. If you don’t land a job or a contract, there are a dozen reasons that have nothing to do with your site. Someone else got hired first. People have increasingly short attention spans and maybe your site took longer than a 1s to load and someone bounced before they saw anything. If you’re optimizing for an outcome you can’t actually observe, you’re just shooting in the dark.
What I optimize for instead
- Time on site, and a low bounce rate. Ensure you are communicating your work as immediately as possible. I personally try to avoid needless animations and transitions that are prevalent on so many websites (when done well, they can be really nice, but too often they are overdone).
- People clicking around and exploring multiple pages. This is why I track the “See More” project suggestions at the bottom of each case study. If nobody clicks them, they’re not doing their job, or they’re irrelevant.
- People going further, off my site entirely. External link clicks tell me whether someone visiting a case study actually goes to check out the live client site or the side project I built. Plus, if I am running analytics on two projects, I can see that traffic continue from one site to another.
- Whether a “Contact Me” button click or a copied email address actually turns into a message landing in my inbox.
That last one is the only metric that really closes the loop. Everything else is just telling you whether people are paying attention. Yes, I want people to spend time on my site to get to know me, the thing I care about most is people reaching out to me to work together. If you read this post, get in touch, I would love to hear from you.
What are you using for analytics? What’s your bounce rate like? What’s your most popular page?